663 private links
A collection of storymaps, dashboards, and applications from students involved in the 2021 course Mapping Justice: Designing Geospatial Tools for Social Change. If you have any questions or comments, feel free to reach out: hello@trubel.co

demographics, U.S. Census, leads in to market segmentation and clustering, business site analysis by ZIP code assignment
A free web-based open-source GIS “textbook” available to anyone interested in using mapping tools to create maps.
Duration: 2 hours | Level: Intermediate | Recommended for: Data Analysts, Data Scientists, Demographers, Planners, Geographers, Developers
From Matthew W. Wilson's (University of Kentucky) Geography 109-010: Digital Mapping Discovery Seminar Fall 2020

download the project files to accompany the QGIS Map Design book
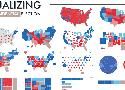
A great collection of various ways to geospatially visualize presidential elections. Done with tableau, not QGIS, but a super handy reference with several visualization strategies all in one place - many do not preserve geographic (land shape) sensibility.
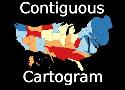
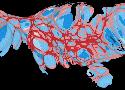
[video] a quick demonstration of continuous/contiguous cartogram using a QGIS plugin (named in video). Again using vaxx rates for COVID-19 as of date of the video's recording.
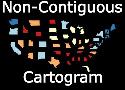
[video] A quick cartogram using a QGIS plugin (named in video) that represents percentage of COVID-19 vaxx.
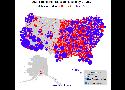
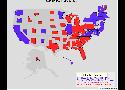
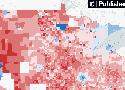
An interactive map that lets readers explore in new detail how most states voted in the 2020 presidential election.