663 private links

demographics, U.S. Census, leads in to market segmentation and clustering, business site analysis by ZIP code assignment
A free web-based open-source GIS “textbook” available to anyone interested in using mapping tools to create maps.
Duration: 2 hours | Level: Intermediate | Recommended for: Data Analysts, Data Scientists, Demographers, Planners, Geographers, Developers
From Matthew W. Wilson's (University of Kentucky) Geography 109-010: Digital Mapping Discovery Seminar Fall 2020

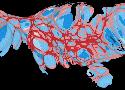
download the project files to accompany the QGIS Map Design book
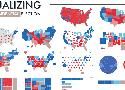
A great collection of various ways to geospatially visualize presidential elections. Done with tableau, not QGIS, but a super handy reference with several visualization strategies all in one place - many do not preserve geographic (land shape) sensibility.
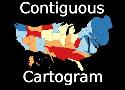
[video] a quick demonstration of continuous/contiguous cartogram using a QGIS plugin (named in video). Again using vaxx rates for COVID-19 as of date of the video's recording.
[video] A quick cartogram using a QGIS plugin (named in video) that represents percentage of COVID-19 vaxx.
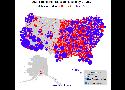
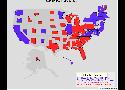
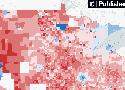
An interactive map that lets readers explore in new detail how most states voted in the 2020 presidential election.

The Open Education Data Dashboard was designed to meet the data collection and tracking needs of those running higher education open education programs. The Dashboard supports data input from program administrators, including data about programs, events, workshops, adoptions, and enrollments; and